Ask how much money you need to retire and you'll get three kinds of answer. A multiple of your salary. A multiple of your spending. Or a year-by-year model. In a recent video, Rob Berger walks through all three and concludes that rules of thumb break down near retirement. He's right. This post shows by how much, using one household run through all three methods.
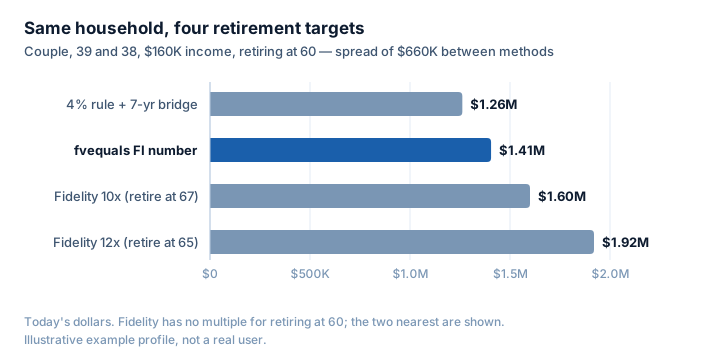
The three answers differ by $660,000. Same household. Same savings. Same spending.
How much money do you need to retire?
Enough to cover the gap between what you'll actually spend in retirement and what Social Security or a pension pays, at a withdrawal rate that has survived historical markets over your full retirement. For the household below, three common methods produce answers from $1.26 million to $1.92 million, which is why the method matters as much as the math.
People who run only one method never see the spread.
Who is the example household?
For illustration, assume the example household is a married couple, 39 and 38, living in Colorado, earning $160,000 combined and planning to retire at 60. It's one of the example profiles built into fvequals, not a real user.
Their numbers:
- Portfolio: $378,000 ($85K brokerage, $220K traditional 401(k), $55K Roth, $18K HSA)
- Saving: $57,800 a year, about 36% of gross
- Spending: $5,820/month, including an $1,800 mortgage that pays off in 2046, the year before they retire
- Social Security: $2,400/month at 67, entered in claim-age dollars. At the app's 3.4% regional inflation assumption, that's about $940/month in today's money.
What does Fidelity's 10x rule say about them?
Fidelity says they're behind, and it can't tell them what they need at 60. Its retirement savings guideline is 3x salary by 40 and 10x by 67, with 12x if you retire at 65 and 8x if you wait until 70.
At $160,000, the age-40 checkpoint is $480,000. They have $378,000, or 2.4x. By Fidelity's scorecard they're $102,000 short.
The retirement target is the bigger problem. Fidelity's table starts at 65, so a retirement at 60 has no multiple. The nearest ones are $1.6 million (10x at 67) and $1.92 million (12x at 65). Neither one looks at what this couple spends.
What does the 4% rule say about them?
Done carefully, the 4% rule puts them at about $1.26 million in today's dollars. That's 25x the annual gap Social Security leaves, plus the cost of the seven years before Social Security starts.
This follows the method in Berger's video. Start with spending, subtract guaranteed income, multiply the gap by 25:
- Retirement spending without the mortgage: $48,240/year
- Social Security in today's dollars: $11,280/year
- Gap: $36,960 × 25 = $924,000
- Bridge from 60 to 67, with no Social Security: 7 × $48,240 = $337,680
- Total: about $1.26 million
This number is already better than Fidelity's, because it starts from spending instead of salary. But the 25x multiple comes from William Bengen's 1994 study, which tested a minimum of 30 years of portfolio longevity. This couple's plan runs from 60 to 100. That's 40.
What does fvequals say about them?
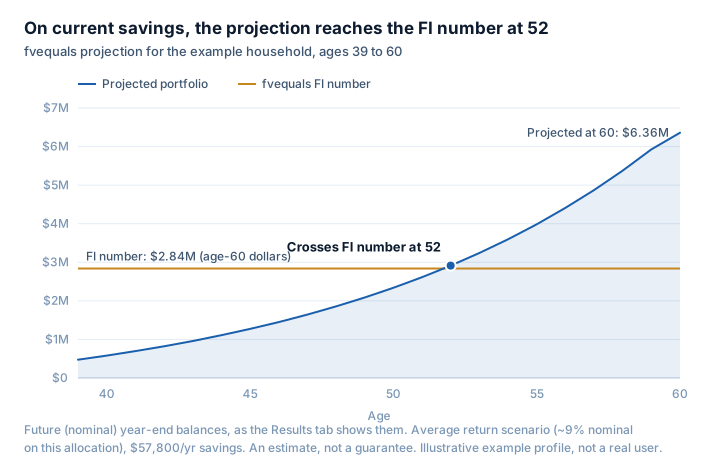
fvequals puts their FI number at about $1.41 million in today's dollars ($2.84 million in the dollars of the year they turn 60). It also projects they'll reach that number at 52, eight years ahead of plan.
Three things move the number:
- Spending at 60 isn't today's spending minus the mortgage. fvequals inflates each budget line at its own rate across the eight CPI major groups the Bureau of Labor Statistics publishes. It also replaces employer health coverage with a marketplace premium from 60 to 64. Medical spending goes from $520/month today to about $1,257/month in today's dollars at 60. Medical rises $737/month and housing $172, while food, recreation, apparel and the rest fall $413/month in today's dollars because they've historically inflated more slowly than the overall rate. Net: +$497/month. Total spending at 60 comes to $54,200 a year, not $48,240.
- The withdrawal rate isn't 4%. The failsafe rate is the highest rate that never ran out of money in any historical market sequence in the data set, over this couple's 40-year horizon, with their tax-aware withdrawal order. It comes out at 3.86%.
- The bridge is part of the simulation. Social Security starts at 67 inside the year-by-year model, and Medicare starts at 65, so the failsafe already accounts for the gap years. There's no separate estimate added on top.
| Method | What it multiplies | Target for this household | Verdict today |
|---|---|---|---|
| Fidelity 10x/12x | Salary ($160K) | $1.6M–$1.92M (no multiple exists for 60) | Behind: 2.4x vs. 3x checkpoint |
| 4% rule + bridge | Spending gap × 25 | ≈ $1.26M | No verdict, a single number |
| fvequals FI number | CPI-category spending ÷ 3.86% failsafe | ≈ $1.41M | Projected to reach FI at 52 |
All figures in today's dollars except where noted. fvequals figures use the app's Average inflation and return scenarios; projections are estimates, not guarantees.
Why do the three numbers disagree?
Fidelity measures income, the 4% rule measures a flat spending number, and fvequals measures what this budget turns into at 60, over 40 years. Each step adds one variable the step before it ignored.
Fidelity's own assumptions explain its number. The guideline assumes saving 15% from age 25, retiring at 67, planning to age 93, and replacing 45% of pre-retirement income with savings. This couple saves 36%, retires at 60, and plans to 100. The rule wasn't built for them. It says so.
The 4% rule's miss runs in the other direction. It comes in about $144,000 below the fvequals number ($1.405M vs. $1.262M) because it treats retirement spending as flat and assumes a 30-year horizon. Healthcare from 60 to 64 and an extra decade of withdrawals are where the difference comes from.
Retiring $144,000 short isn't a rounding error.
What did building this comparison show?
Three reasonable methods gave three very different answers for the same couple, from $1.26 million to $1.92 million. Nothing about their situation changed, only the method.
Each method looks at a different piece of the picture. Fidelity’s rule looks at your salary, so it doesn’t know how much you actually spend, or that this couple is saving far more than its guideline assumes. The 4% rule looks at your spending, which is better, but it treats that spending as one flat number and assumes a retirement of about 30 years. This couple plans for 40. The third method starts from their real budget and asks what each item will cost at 60, including health insurance before Medicare starts. It also tests the plan over the full 40 years.
The takeaway is that a simple rule is a good first check, but it can send you in either direction. Fidelity’s rule says this couple is behind. The budget-based method says they’re on track to reach their goal at 52, eight years early. Both can’t be right for them, and only the one built from their own numbers can say which is.
Which number holds up?
The one built from your own budget, tested over your own horizon. A salary multiple is a reasonable scorecard decades out, and the 4% rule is a reasonable sanity check, but neither can see a 60-year-old's marketplace premium or a 40-year retirement.
The FI number above doesn't depend on the return assumption. It's set by historical market sequences and the household's spending. The age-52 projection does depend on returns: it uses the app's Average scenario, about 9% nominal on this allocation. A worse decade moves the date, not the target. The full formulas and data sources are on the methodology page.
If you already track a budget, fvequals turns it into this number in about ten minutes. No bank connections, no account aggregation.
Start your 14-day free trial — no credit card required